Shielding Effectiveness with CST Studio
Hi,
I want to calculate and draw SE(Shielding Effectiveness) in middle of the rectangular enclosure with CST. How can i do that? Please help me.
Thank you.
Check out the getting started videos for CST and learn how to draw models. Probes are used to measure E and H fields at any point you wish. Also look into the excitation types that would suit your design.
Thank you for answering. I did all you have said and I have a problem. In transient solver, there is a huge oscillation on the results' plot and after, I tried to measure the E field in the frequency domain solver and I achieved more accurate and time effective results. When I measure the field between 0 and 1 GHz, there is not a problem, but when I measure the field between 0 and 2 GHZ or 3 GHz in frequency domain solver, after at 1.5 GHz, there is a problem. Measurements are not good and meaningless (after at 1.5 GHz). I attached the plot to the message. What can I do?
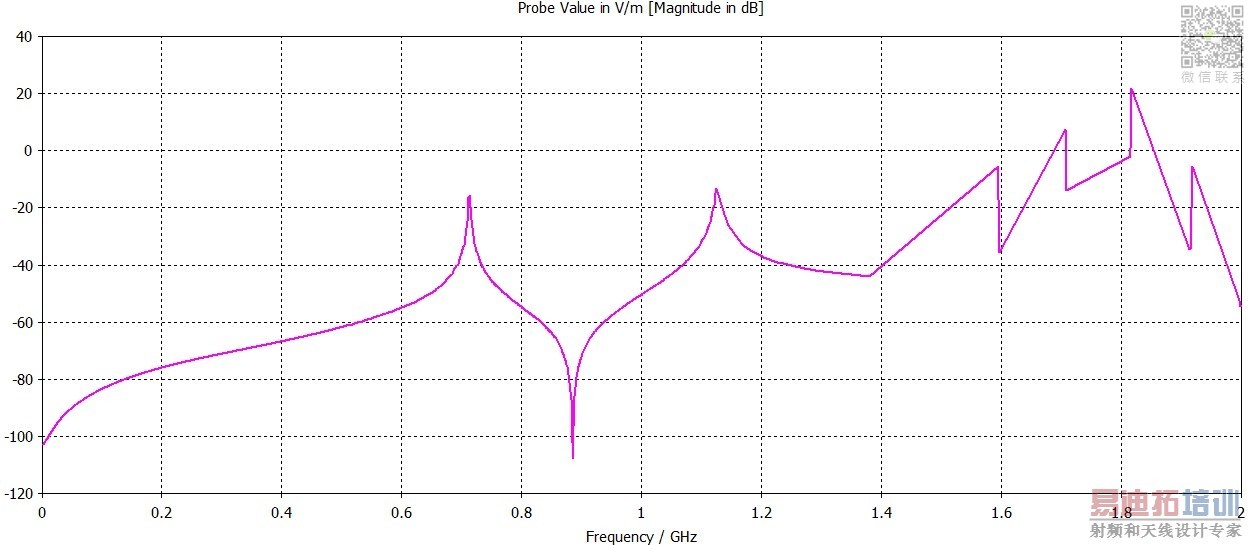
For the enclosure that you have designed in ... at higher frequencies other modes also propagate.thats why you are getting..read up more theory on waveguides nad apertures n how they behave at higher frequencies..may be you'll get the over all idea!
I understand. I will search and learn what you said, thank you. So, what should I do to prevent that in CST frequency domain solver ? Can you help me, please?
CST is pretty right in its way..but practically if you want to prevent other modes from cropping up in your waveguide, you usually make slits or using waveguide filters in the waveguide and this can be implemented in your design in CST. Get your theory right. It'll help clear small doubts and help in designing too coz then you can analyze yourself if the results you're getting is right or wrong.
Thank you for your advises, but I solved my problem with decreasing the number of samples in frequency domain solver.
Hi every one,
I am beginner in CST i need to simulate a enclosure and Find a Shielding effectiveness, can anyone help me to do the same.
my frequency range is 3 GHz how to plot a SE in CST or HFSS
Thanks in advance
Hi,
Sorry for late answer.
In CST, When you set the probe in the enclosure or wherever you want to observe E or H field, You should look at the left side of the program screen and you can see Navigation tree. In navigation tree, there are results and other thing. You should check the "1D Results" section and open that section. In there, there is a probe folder, when you open it, you can see the fields results. These/This results/result measurement in dB/m of voltage. If you take inverse, you can plot or observe SE in dB?
Actually, I have a problem with CST frequency domain, when I am simulating. Between 0-1.5 GHz there is no problem,but when I am simulating between 0-3 GHz, after nearly 1.5 GHz, there are distortions between 1.5-3 GHz.
I am also working on shielding effectiveness of enclosures. I did not get smooth pattern. iam getting ripples on it. plz help me.
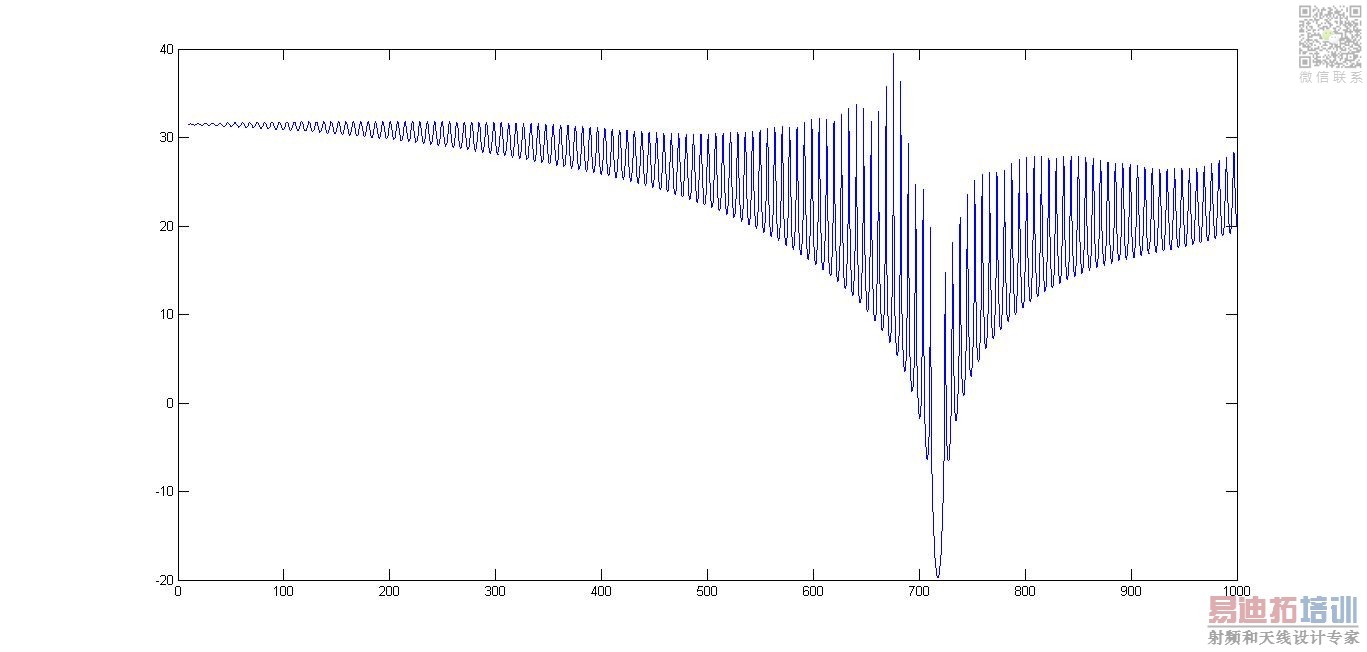
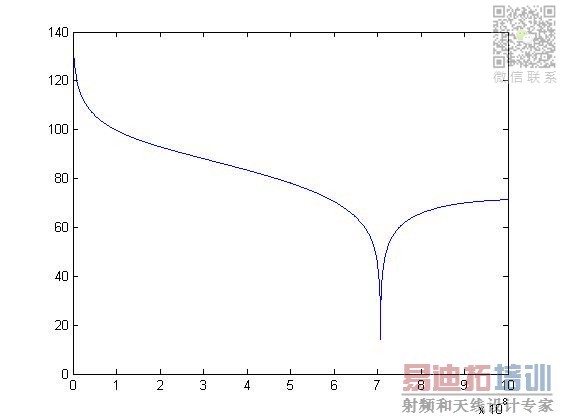
I think you are working with transient solver? If that so, You should increase "number of pulses" in transient solver settings in specials tab to decrease ripples on the results. But remember this, increasing "number of pulses" will increase solving time in transient solver.

